Reports and Dashboards
Modern, sophisticated, and informative
Create Amazing Reports – No Programming Required
Through the APEX designer tool, you can effortlessly grab your data from multiple sources, process it, and present it. The highly customizable objects enable you to make your reports as simple, or complex as you need them to be. Impress your users by how quickly you can deliver their requests in form of impressive graphical reports.
Customizable Components
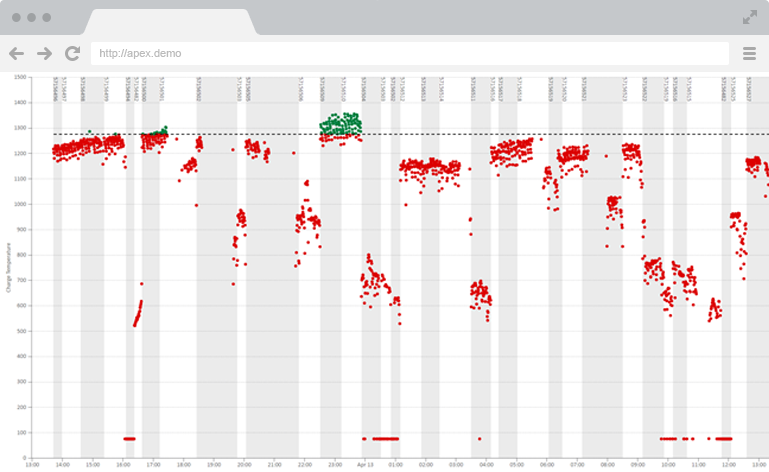
Choose from a library of highly graphical, dynamic and modern components, such as:
- Data Grids
- Bar Charts
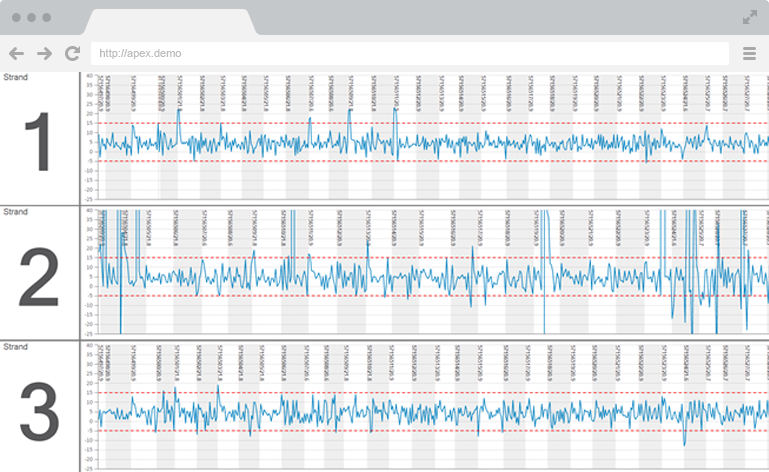
- Line Charts
- Area Charts
- Gantt Charts
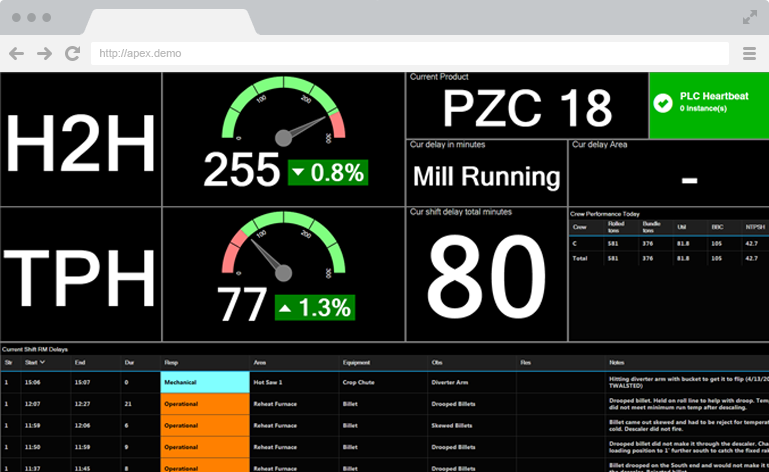
- Gauges
- Histograms
- And Many More…
Object Oriented Design
Design a component once and reuse it in multiple reports. Each component can be further customized in each report.
Interactive Reports
APEX reports are fully interactive to enable users to get the most out of the information. The users can perform actions such as group, sort, zoom, rearrange and more.
Data Editing
Enable your users to view their information and make any possible changes to the data all at once. You can develop reports with full data editing capabilities such as add, delete, insert and edit.
Data Export
Provide users with easy ways to export large amounts of data directly into excel.
RSS Feeds
Integrate your company’s news feed into your reports, as well as other feeds from around the Internet.
Slide Shows
Designed for overhead displays and kiosks, multiple reports and dashboards can be displayed in sequence in an infinite loop. Displayed information is in real time, and always up-to-date.
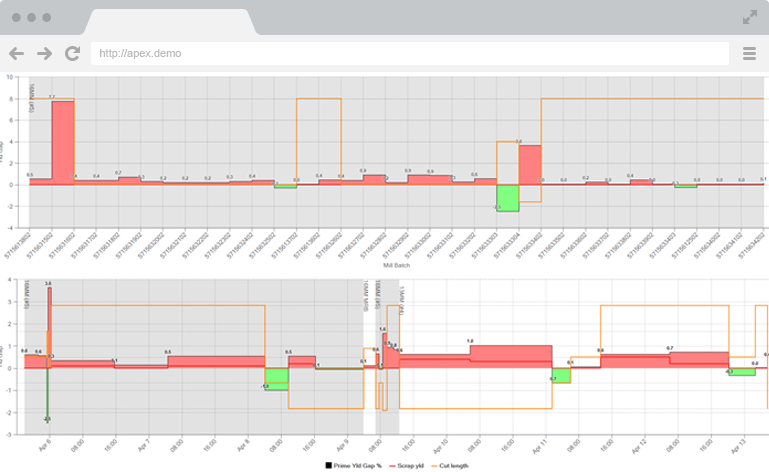

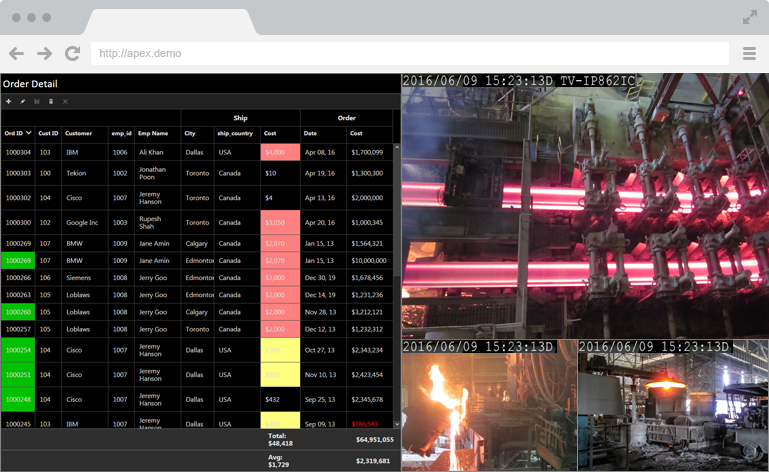
Conditional Formatting
Conditional formatting can greatly enhance the readability of your reports. You can change the coloring and other visual appearance of your reports based on set rules, goals, etc.
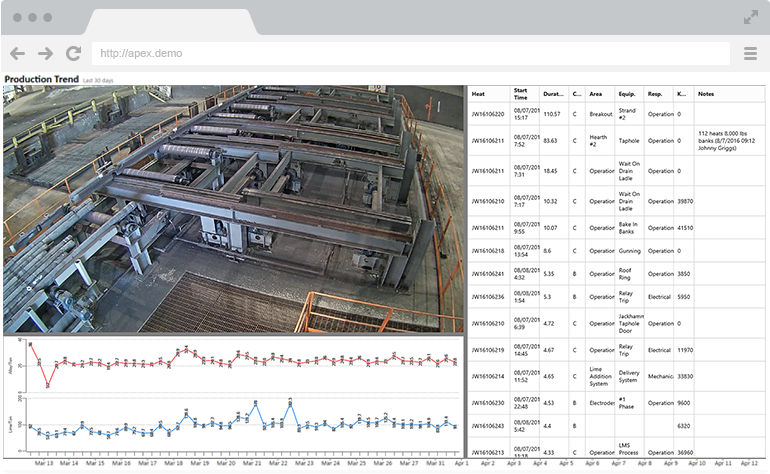
Camera Feeds
Create the ultimate digital display by combining your key performance reports with live feed from your process cameras